

Analyzing 5-Star Rating Statistics for the Top 500: Insights and Trends for Pro-Wrestling


A Deep-Dive into the Wrestling Observer Top 500
Over the past six years, I have accumulated extensive experience in working with large databases and datasets on a daily basis. Notably, my professional pursuits have seldom intersected with my personal interests. My enduring passion for statistics was ignited by an unconventional source – the world of professional wrestling. From an early age, I have been an ardent admirer of professional wrestling, and it has consistently captivated me with its multifaceted elements, including the diverse array of wrestlers, venues, championship titles, match types, and audience attendance figures. Regrettably, my current employer is facing closure, and in light of this development, I have chosen to allocate some of my available time to the development of a comprehensive portfolio aimed at showcasing my analytical skills. Although I have already integrated data analysis into my current professional role, which includes administrative responsibilities, I have decided to embark on a more engaging and formal project. Specifically, I am in the process of creating a report that delves into the Wrestling Observer Newsletter's renowned and often polarizing 'Top 500' list. After conducting extensive research, it has come to my attention that the field of professional wrestling remains strikingly underexplored in terms of data analysis, save for a remarkably comprehensive report on Ric Flair's illustrious career, which I recently encountered. I have meticulously outlined the primary focal points for this forthcoming report and have diligently commenced my research efforts.


Credit @ profightdb.com
In my quest to acquire Pro-Wrestling data, two websites prominently surfaced in my considerations: ProFightDB, which primarily offered reports of wrestling shows, and Cagematch, often described as the IMDb equivalent for wrestling matches. Cagematch, despite its native German origins, furnished match ratings, occasionally presented on various web pages in the German language. In contrast, ProFightDB presented its data in a more user-friendly manner, with all crucial elements, including the pivotal 'Star Ratings,' conveniently organized on a single, comprehensible page. This layout incorporated essential details such as the name of the event, its date, and other pertinent information. However, I sought to enrich my dataset with additional variables, encompassing details such as the city and country where the events took place, the promotion responsible for the event, and any relevant championship titles involved. With these considerations in mind, I ultimately opted for ProFightDB as my primary data source. Subsequently, I embarked on the process of extracting the requisite information from this website.
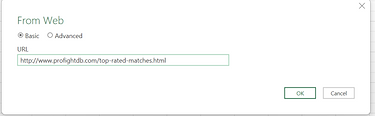
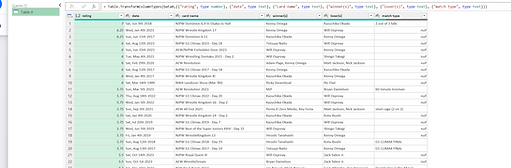
'From Web' then straight into Power Query

Upon importing the data, I initiated the data transformation process and observed that all the column headers were in lowercase. To enhance data readability and consistency, I promptly commenced the task of capitalizing the column headers. Next, I noticed a significant number of 'null' errors in the 'Match Type' column. In order to standardize this field, I opted to replace these 'null' values with 'normal,' signifying standard matches. However, after a meticulous evaluation, I made the decision to eliminate the 'Match Type' column altogether. This choice stemmed from the realization that the overwhelming majority of matches fell into conventional tag team or singles categories.
Furthermore, I addressed the date format issue, where dates appeared as 'Mon, 12th December' with a comma. To rectify this, I applied a custom date format and subsequently separated the year into a distinct column. This separation facilitated a cleaner presentation of date-related information when creating the Power BI report.
Notably, the initial dataset lacked a column denoting the championship titles featured in each match. In response, I embarked on an extensive investigation of Cagematch's extensive database, ultimately setting up a macro for quick and efficient title entry. This macro enabled me to assign titles to matches promptly with a keyboard shortcut, for example, using CTRL-SHIFT-I for 'IWGP World Heavyweight Championship' or CTRL-SHIFT-T for 'Triple Crown Title.' The motivation behind introducing a 'Championship' column was to emphasize the vital role of championships in professional wrestling, particularly in the context of measuring success, a principle that holds particular significance in the world of Japanese wrestling.

Credit @ yahoo.com
Upon concluding the process of gathering the pertinent 'Championships' data from Cagematch.com, I made a deliberate choice to further enhance the dataset by incorporating information about the promotional organizations involved. To achieve this, I returned to Power Query and introduced a conditional column contingent upon the presence of the promotion's name within the 'Show Name' field. Specifically, if the 'Show Name' contained, for instance, 'NJPW,' the 'Promotion' column was populated with 'NJPW.' This strategic inclusion of the promotion variable is of paramount importance as it will facilitate the tracking of promotional trends and gauge the popularity of the organizations featured within the dataset. Upon defining the expected values in the 'Promotion' column, I executed the 'Close and Load' operation, solidifying this latest enhancement. Subsequently, I addressed the task of assimilating venue information into the database. Leveraging my proficiency in formula utilization, I employed 'IF' statements to categorize events accurately based on the 'Show Name.' For instance, if the 'Show Name' contained 'Wrestlemania,' the 'Promotion' was unequivocally tagged as 'WWE,' and if 'WrestleKingdom' was detected, it was attributed to 'NJPW.' This meticulous data refinement procedure bolstered the overall dataset.Moreover, I embarked on an initiative to introduce the concept of ranking by allocating the top thirty 'Star Ratings' into distinct Gold, Silver, and Bronze rows. This stylistic stratification, aside from its aesthetic appeal, was augmented by the assignment of unique identifiers (IDs). This approach was adopted to facilitate potential correlation exploration during the subsequent stages of the Power BI analysis, allowing for deeper insights into the data's underlying relationships.
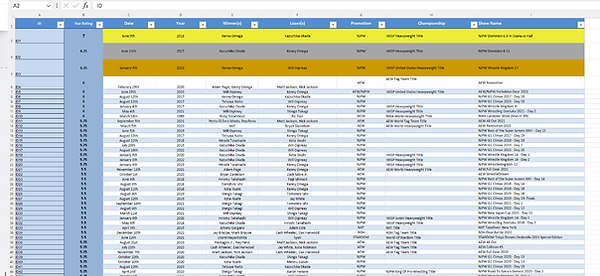

Although often subjected to exaggeration by other promoters, the 'Attendance' factor assumes a pivotal role in our analysis, providing valuable insights into the relative success of wrestling promotions. It offers a gauge of which promotions are thriving and which ones are facing challenges. Moreover, it sheds light on the influence of geographical factors, particularly the impact of different cities on attendance figures. Regrettably, the documentation of attendance in the realm of professional wrestling has been far from comprehensive. There were sections with either no information or significant gaps in the data, which are indicated by the yellow markers in the dataset. The onset of the COVID era further exacerbated this issue, introducing a significant disruption in wrestling attendance records, also highlighted in yellow. Efforts were made to automate the attendance data entry process, involving web scraping using Python and employing 'Fuzzy Matching' techniques in Power Query. However, these attempts did not yield the desired results, given the complexity and volume of data spread across numerous web pages. Consequently, I embarked on a methodical manual review and data entry process, methodically sifting through attendance records. To my satisfaction, I found that as I gained momentum, the process became more efficient and manageable than initially anticipated. I take pride in having successfully obtained accurate attendance data through this diligent manual approach.

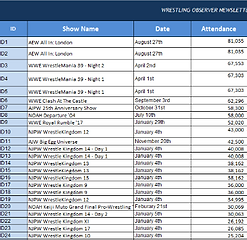
Subsequently, I harnessed my wrestling acumen to further enhance the dataset by associating specific venues with their corresponding wrestling events. For instance, I recognized that 'Wrestle Kingdom' consistently took place at the illustrious 'Tokyo Dome,' and I harnessed the power of 'IF' statements to automate this association. In this process, I bid farewell to the previous macros and crafted new ones tailored for venues. Notably, I was well aware of the prevalence of matches hosted at the legendary 'Korakuen Hall,' 'Budokan,' and 'Kokugikan' venues. To streamline data entry, I implemented CTRL-SHIFT macros for each of these venues. This allowed me to effortlessly input venue information with shortcuts like CTRL-SHIFT-K, CTRL-SHIFT-N, and CTRL-SHIFT-K, corresponding to 'Korakuen Hall,' 'Budokan,' and 'Kokugikan,' respectively. This meticulous approach not only expedited the data entry process but also ensured accuracy in associating events with their respective venues.

In the course of this data refinement process, I also successfully ascertained the respective countries associated with the events. For instance, with only a few exceptions, it became evident that an AEW show was typically held in either the 'USA' or 'Canada,' while a AAA show predominantly took place in 'Mexico,' and an 'AJPW' event was predominantly hosted in 'Japan.' To implement this geographical categorization, I revisited Power Query and utilized conditional columns to determine the countries based on the promotion or event. While considering additional methods such as VLOOKUP, I ultimately opted for a more user-friendly approach by implementing a 'Slicer' feature. This strategic choice allowed for an intuitive and user-friendly means of accessing specific promotions and dates from the database, enhancing the overall usability of the dataset. I also made a graph with additonal information that I made called 'Wrestler Stats', with some sleek graphs showing how many times a wrestler was featured, Wins/Loses or Win Ratio.



Prior to importing the data into Power BI, I embarked on a quest to enhance the visual appeal of the forthcoming report. My exploration led me to investigate reports and challenges featured on platforms like Maven Analytical, inspiring my aspiration to craft a report of similar caliber. This inclination arose from my recognition of Power BI's inherent limitations in terms of customization. Seeking to elevate the quality of my report, I delved into additional resources for guidance. One notable recommendation I encountered on YouTube involved the utilization of editing software called 'Figma.' This software was instrumental in my quest to infuse the report with visually engaging elements such as images and stylized text, seamlessly integrated with an interactive dashboard.
In pursuit of these objectives, I undertook a learning journey, perusing instructional videos to acquire proficiency in techniques like shape masking within Figma. This preparation allowed me to embark on the report creation process with a refined and innovative approach. Consequently, before venturing into Power BI, I had already fashioned a visual presentation akin to the envisioned outcome.

The time had come for the visualization phase, as the data had undergone meticulous preparation and successfully traversed the Power Query stage. I had uploaded the entire Excel file, comprising workbooks of both relevance and those that required exclusion. My focus was centered on selecting components that could elucidate the most intriguing trends and constituted the foundational pillars of my columns. To construct a cohesive narrative, I strategically allocated these aspects to distinct pages within the visualization. The first page prominently featured the 'Star Rating,' while the second page showcased 'Championship' insights. The third page was dedicated to 'Promotions,' and the fourth page delved into 'Venue' details. To streamline the representation, I made an informed decision to omit the 'Country' variable from the visualizations, as the data clearly indicated that matches from Japan held a dominant position, and this omission allowed for a more focused exploration of other pertinent trends. The 'Star Rating' page incorporated an interactive pie chart and scatter plot, which artfully conveyed the intricate relationship between average star ratings and the cumulative star count. Additionally, a treemap on the left-hand side highlighted the top 10 wrestlers with the highest win rates. On the second page, I provided a comprehensive overview of championship statistics, including the frequency of appearance in the list, the count of promotions featuring the title, and the total number of titles won by wrestlers within the respective promotions. This approach served to offer a multifaceted perspective on the championship landscape.


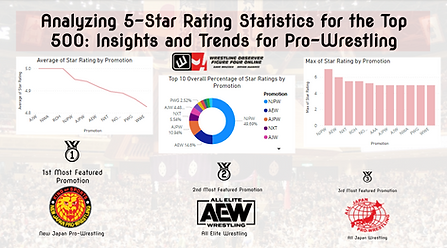
On Page 3, I focused on 'Promotions,' meticulously presenting data related to this integral aspect of the wrestling industry. The page offered valuable insights such as the 'Average Star Rating' by promotion, highlighting the overall performance of various promotions. Additionally, it showcased the 'Top 10 Overall Percentage of Star Rating,' emphasizing the most notable contributors to the star rating landscape. The 'Max Star Rating by Promotion' served as a notable point of reference for identifying the zenith of star ratings achieved by different promotions. Page 4 was dedicated to arguably two of the most pivotal countries in the realm of professional wrestling, namely 'USA' and 'Japan.' The page incorporated interactive maps with legends that, upon clicking, revealed specific star ratings and venues. The culmination of this section was the presentation of the 'Overall Attendance of the list by Country,' providing an illuminating perspective on the global reception of wrestling events.In an effort to augment the visual appeal and provide a more immersive experience, I thoughtfully included images at the bottom of the page, each corresponding to the top three venues. These images added a dynamic element to the presentation, enhancing the overall storytelling. Despite the occasional monotony of certain aspects of the process, I must confess that I thoroughly enjoyed this endeavor. Looking ahead, I am inclined to consider datasets that are less encumbered by elusive information to streamline the analysis and visualization.

Feel free to download the Excel file !
Let’s Work Together
Get in touch so we can start working together.